


“Our vision is for a world protected from the social, economic,
and environmental damages of climate change.”
Carbon Majors
4 April 2024: We are excited to announce that our colleagues at InfluenceMap in London has released a full update of the Carbon Majors dataset to 2022, and published a Carbon Majors launch report. InfluenceMap plans to update the Carbon Majors dataset annually.
Questions can be directed to Daan Van Acker, Sr Analyst, InfluenceMap: daan.vanacker@influencemap.org
And to Richard Heede, Climate Accountability Institute: heede@climateaccountability.org
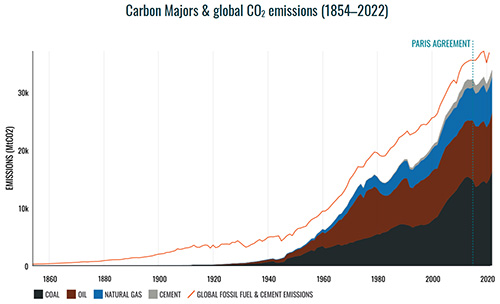
InfluenceMap (2024) The Carbon Majors Database: Launch Report, page 2

Climate Accountability Institute releases treasure trove of data on fossil fuel company operational
and product-related emissions.
Update 8 October 2019: Accounting for carbon and methane emissions, Top Twenty investor-owned and state-owned oil, gas, and coal companies 1965-2017
Animation for CAI by Adam Nieman, Real World Visuals, Bristol
CAI has updated all Carbon Majors to 2017 activity data, and we post a sample of the results and individual worksheets below:
Read the Commentary in The Guardian and the Polluters Series
Sample charts and worksheets for the 2017 update:

Accounting for carbon and methane emissions 1854-2010
In groundbreaking peer-reviewed research forthcoming in Climatic Change, researcher Richard Heede offers the most complete picture to date of which institutions have extracted the fossil fuels that have been the root cause of global warming since the Industrial Revolution. Rather than attribute emissions to nations, the study aggregates historical emissions according to carbon producing entities themselves. Heede concludes that nearly two-thirds of carbon dioxide emitted since the 1750s can be traced to the 90 largest fossil fuel and cement producers, most of which still operate today.
Richard Heede’s paper in Climatic Change (21Nov13), including supplementary material
Richard Heede’s (7Apr14) Carbon Majors: Methods & Results Report
Read the article in The Guardian (20Nov13) by Suzanne Goldenberg
The Objectives
The primary objective is to quantify and trace historic and cumulative emissions of carbon dioxide and methane to the largest extant fossil fuel and cement producers. This project focuses on the industrial carbon fuels and cement manufacturing, and details the annual and cumulative contribution of each of the largest 90 producers from as early as 1854 (but typically later) to 2010. National greenhouse gas (GHG) inventories estimate aggregate emissions of the six “Kyoto gases,” chiefly from fuel consumption, process emissions, fugitive methane, and land-‐use changes. This project’s focus is to trace emissions back to the corporate producers of the lion’s share of the world’s carbon fuels and cement.
Current production of fossil fuels by multinational and state energy enterprises is well known, as are the historic emissions of the world’s 196 countries. This project is a first attempt at aggregating historic data by carbon producing entities. The work is unique in converting production of all fossil fuels into the carbon content and resulting emissions of carbon dioxide upon the combustion of marketed fuels, and in tracing emissions to the primary producing entities.
The project traces the emissions from fossil fuels produced and made available to the world markets and consumers that when used as intended result in emissions to the atmosphere. These “indirect” product-related emissions account for ~90 percent of total emissions traced to the ninety entities. Additional “direct” emissions attributed include vented CO2, flared CO2, emissions from own fuel use, and fugitive and vented methane from oil and gas systems and coal mining.

The research attributes 63 percent of the carbon dioxide and methane emitted between 1751 and 2010 to just 90 entities. Fifty are investor-owned companies such as Chevron, Peabody, Shell, and BHP Billiton. Thirty-one are state-owned companies such as Saudi Aramco and Statoil, and nine are government-run industries in countries such as China, Poland, and the former Soviet Union. The research also classified the 90 entities according to type of fossil fuel extracted and marketed. There are 56 oil and natural gas companies, and 37 coal producers. In addition, the CO2 emissions from seven cement manufacturers are included.
Heede’s research reveals:
- Emissions traced to investor-owned entities clock in at 315 gigatonnes of carbon dioxide equivalent, narrowly surpassing emissions from government-run industries, which totaled 312 gigatonnes. State-owned companies, meanwhile, contributed 288 gigatonnes.
- The largest investor-owned producers have had an outsize effect on emissions. The top 20 produced fuels that comprised 29.5 percent of emissions, while the top 10 account for 15.8 percent.
- Half the emissions traced to the ninety “carbon majors” have occurred since 1986, demonstrating the increasing speed with which fossil fuels are being burned.

Implications
It’s difficult for researchers to find complete extraction records, so there are advantages to greater corporate and government transparency requirements, including more thorough assessments of direct and product-related emissions.
In addition to further analysis that can be conducted through the dataset itself, the approach — looking at producers rather than nations — opens many doors for future research. Scientists running climate models, for instance, could use this data to determine how different effects of climate change can be attributed to the 90 entities in the study.
The results may also have practical policy applications. The United Nations Framework Convention on Climate Change, the primary forum for international climate discussions, typically focuses on responsibility at the country level. This research provides another lens to examine global climate policy since it offers the first comprehensive accounting of historical emissions from producers, including many multi-national institutions that initially extracted fuels from the earth.
Access the Carbon Major 2010 Data Set here.
In 2014 Climate Accountability Institute released the following update of the Carbon Majors Project – detailing the emissions traced to the major industrial carbon producers in the oil, natural gas, coal, and cement industries — through the year 2013.
Carbon Major Entities Cumulative Emissions to 2013 Ranked (PDF)
Carbon Majors cumulative emissions to 2013 Alphabetized (PDF)
Summary of all Carbon Majors by fuel, compared to global CO2 emissions 1751-2013 (PDF)
Chart of Carbon Majors and Global CO2 emissions 1810-2013
Chart of Carbon Majors and total historic emissions 1751-2013
Chart of Carbon Majors by ownership and total historic emissions 1751-2013
Chart of Top Twenty companies, in percent of global CO2 and methane from 1751 to 2013
Chart of Top Six Carbon Majors, annual attributed emissions 1910 to 2013
Chart of All Carbon Majors by emission sources
Carbon Majors emissions traced to Oil & NGL production (PDF)
Carbon Majors emissions traced to Natural Gas production (PDF)
Carbon Majors emissions traced to Coal production (PDF)
Carbon Majors emissions traced to Cement production (PDF)
Also in 2014, the Climate Accountability Institute released an analysis of global fossil fuel and cement emissions of CO2 since 1751 that calculates the proportion emitted since 1988 ‹ when the evidence and risks of human-caused warming first became widely known.
Half of all global industrial CO2 emissions since 1751 emitted from 1988 through 2014